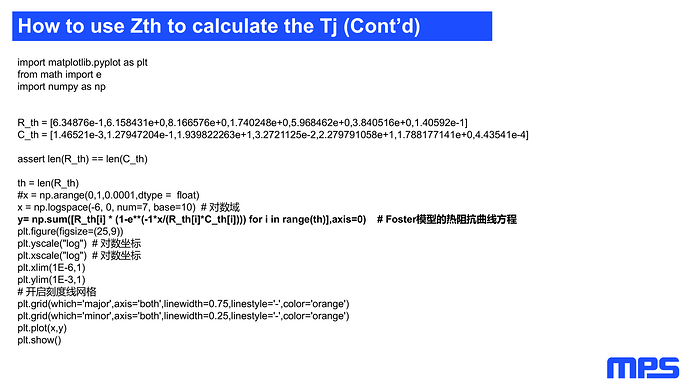
有了参数,带入公式可以得到热阻抗曲线,这里展示的就是用python绘制的曲线;
import matplotlib.pyplot as plt
from math import e
import numpy as np


R_th = [6.34876e-1,6.158431e+0,8.166576e+0,1.740248e+0,5.968462e+0,3.840516e+0,1.40592e-1]
C_th = [1.46521e-3,1.27947204e-1,1.939822263e+1,3.2721125e-2,2.279791058e+1,1.788177141e+0,4.43541e-4]

assert len(R_th) == len(C_th)

th = len(R_th)
#x = np.arange(0,1,0.0001,dtype =  float)
x = np.logspace(-6, 0, num=7, base=10)  # 对数域
y= np.sum([R_th[i] * (1-e**(-1*x/(R_th[i]*C_th[i]))) for i in range(th)],axis=0)    # Foster模型的热阻抗曲线方程
plt.figure(figsize=(25,9))
plt.yscale("log")  # 对数坐标
plt.xscale("log")  # 对数坐标
plt.xlim(1E-6,1)
plt.ylim(1E-3,1)
# 开启刻度线网格
plt.grid(which='major',axis='both',linewidth=0.75,linestyle='-',color='orange')
plt.grid(which='minor',axis='both',linewidth=0.25,linestyle='-',color='orange')
plt.plot(x,y)
plt.show()
